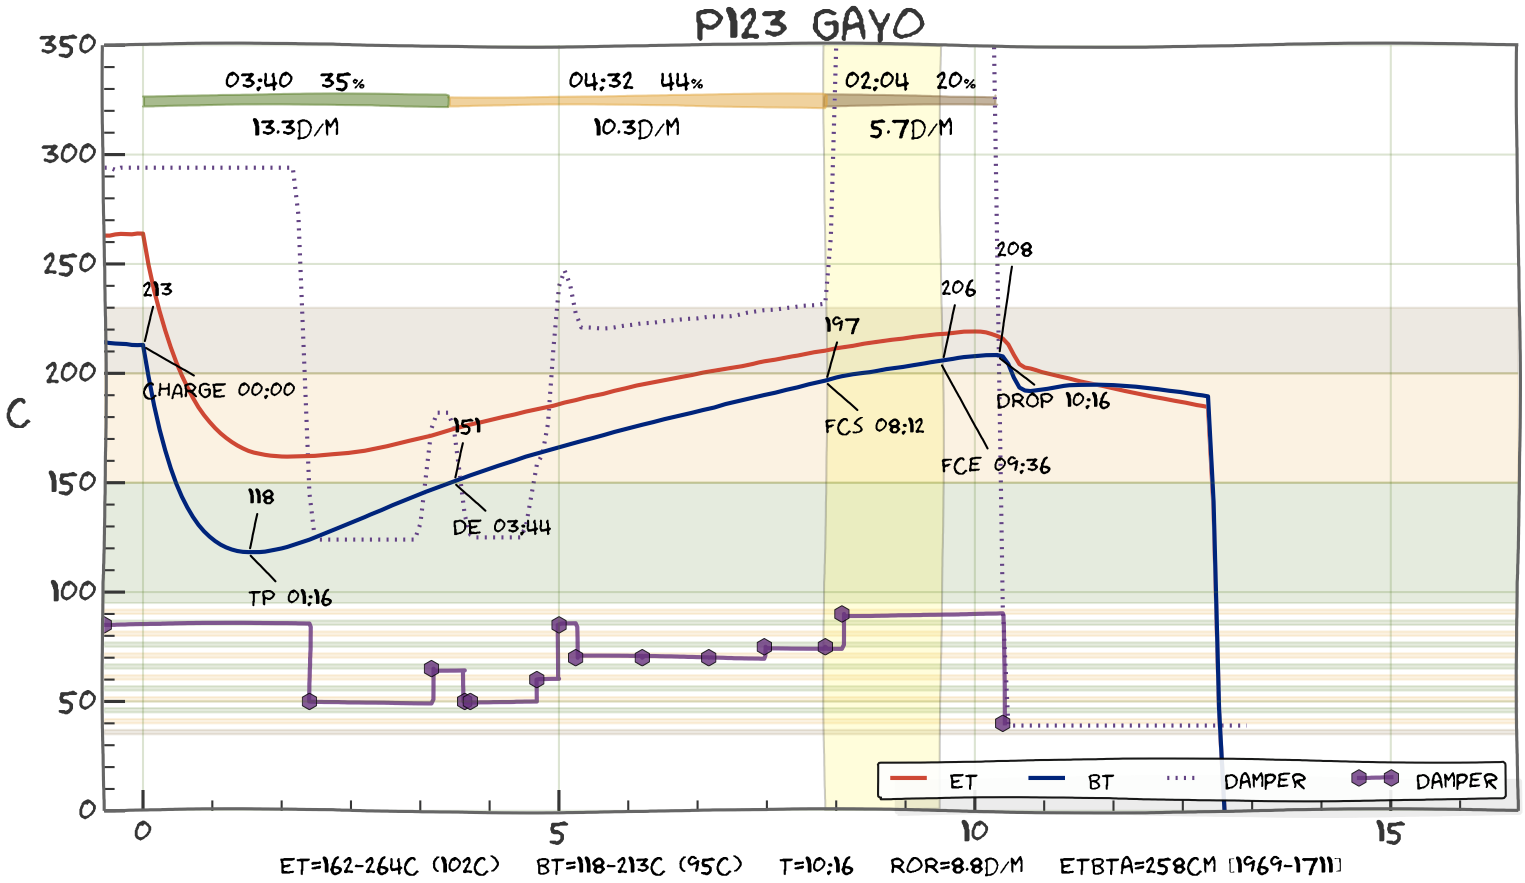
Suppose you have connected a device to Artisan that measures the gas pressure of your burner or the setting of your damper. Wouldn't it be better to log this data as events reflecting changes on a 0-100% scale, instead of squeezing this data as a curve with a strange temperature scale in the graph?
As of Artisan v0.7.5 you can define event quantifiers that observe a curve and map it to a scale of 0-100 and log corresponding events on changes. Suppose you have a curve that logs the position of your air damper, reporting values around 60 if the damper is fully closed and around 300 if the damper is fully open.

Uncheck the corresponding curve (menu Config >> Device) to remove its line from the roast graph (below still shown as dotted line). Then activate the event quantifier "Damper" (menu Config >> Events, 4th tab "Quantifiers"), specify the damper curve as source, 60 as min and 300 max value.
In the roast graph below you see how the DAMPER events at the button is following the shape of the damper input curve drawn as dotted line. The custom events generated by event quantifiers can be treated as any manual generated custom events (see Events, Buttons, Palettes).